Translate

Thursday, May 30, 2013

Which is More Overbought: US Dollar or S&P 500?

A market will rise until it doesn’t. Both fundamental and technical debate has raged over the months and years about the legitimacy of risk appetite’s rise from the ashes back in 2008/2009. That conversation only grows more intense as record highs for benchmarks like the S&P 500 scale record highs while market yields scrape record lows, growth has proven inconsistent and market participation holds to anemic levels. The external element that fills this wildly divergent gap between price and potential: stimulus.
While the risk-sensitive (stimulus-dependent) capital market’s climb is one fundamental abnormality that is now a common topic of conversation, a relatively newer stimulus-generated disparity has gained far more interest as of last – the positive correlation between risk appetite and the US dollar’s performance. Traditionally, the favored safe haven for the FX world, we expect the greenback to fall while even an ill-deserved risk run is underway.
With the introduction of speculation surrounding Fed ‘tapering’, we have likely lit the fuse for a reversal from one of these two assets. Why? Either the Fed starts to temper its support and risk built on a constant escalation of outside support falls apart will collapse. Otherwise, the dollar’s recent surge to near three-year highs on expectations of an immediate QE3 taper will prove overdone. So, which of these measures of market appetite have over-run their reasonable bounds? (As market conditions change, so should your strategy)
The lynchpin is sentiment itself. If the low-volume, high-reach speculative build up holds steady (it may not even have to post progress); the US dollar will take a spill. Alternatively, if a shock of fear shoots through the market, the greenback will turn from ‘overbought’ to bull trend immediately while the record high S&P 500 will dive over a cliff.
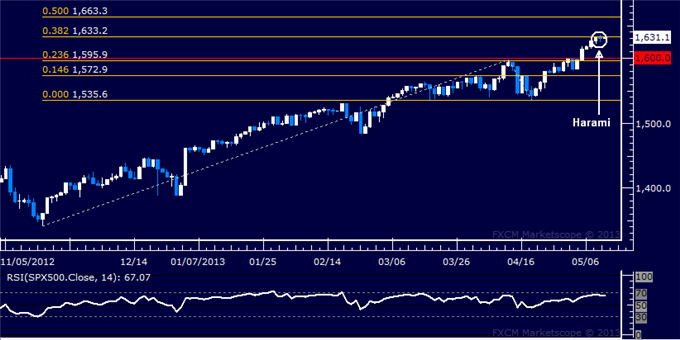
While wait for the fundamental spark to settle this debate, here are measures that show just how overbought the dollar and S&P 500 are.
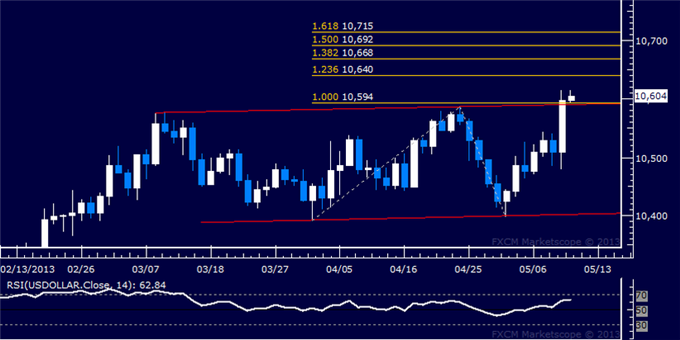
The US Dollar (Dow Jones FXCM Dollar Index)
Which_is_More_Overbought_US_Dollar_or_SP_500_body_Picture_5.png, Which is More Overbought: US Dollar or S&P 500?
Charting Created by John Kicklighter usingMarketscope 2.0
One of the more recognizable measures of overbought markets is the simple RSI indicator. Above, you see that the standard 14-day RSI has crossed back below 70, so it has crossed down from its ‘extreme’ reading.
Which_is_More_Overbought_US_Dollar_or_SP_500_body_Picture_6.png, Which is More Overbought: US Dollar or S&P 500?
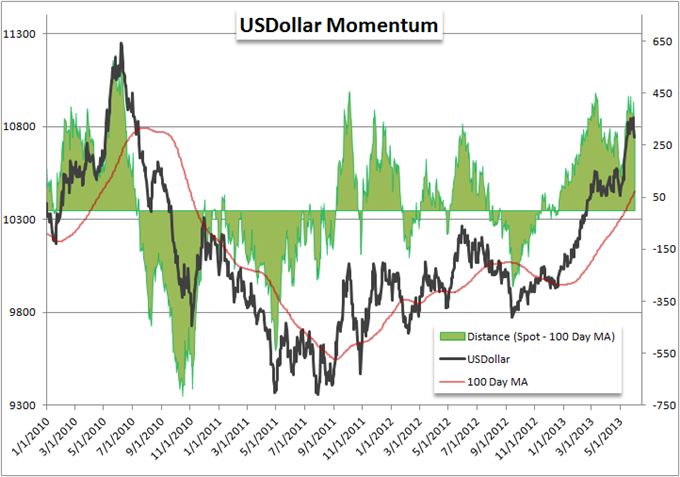
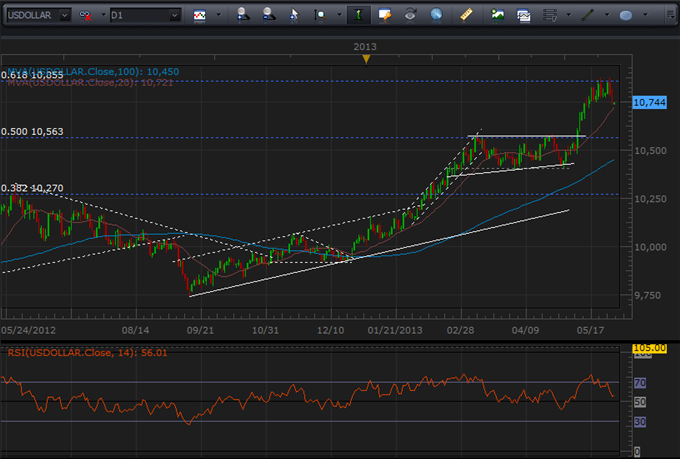
Next we have a different type of read. This uses the 100-day moving average to measure momentum. The green reflects how far above or below USDollar has moved beyond its average. The further it stretches, the greater the potential that the market is overdone. Recently, we have started to pull back from a 450 point spread – the peak back at the beginning of the year and July 2010.

EUR/AUD off fresh 1.5-year highs below 1.35

FXstreet.com (Barcelona) - EUR/AUD is last at 1.3491, off yesterday's fresh 1.5-year highs at 1.3541, up +0.66% for the week so far, +6.27% year to date, and +8.25% in last 6 months. As IFR Markets analyst Andrew Spencer points out, it has been already 8 weeks of higher lows in the cross.

“EUR/AUD continues to march higher and barring any unexpected negative news from the EZ, my technical target at 1.38 looks very achievable,” said FXWW founder Sean Lee, reporting stop loss orders above the 0.9720 level in the AUD/USD. Private sector credit data in Australia came in line with expectations at +0.3%, slightly above last 3 months, leaving Aussie muted on the news.

Immediate resistance to the upside for EUR/AUD shows at recent session highs 1.3524, followed by yesterday's fresh 1.5-year highs at 1.3542, and Sept 2010 lows at 1.3629. To the downside, closest support lies at current levels as Wednesday's highs 1.3475, followed by Monday's highs at 1.3450, and Friday's highs at 1.3433.

How to Trade with Bollinger Bands in Forex Trading.

Bollinger bands are used to measure the volatility in the price action. They work in almost all market and with any type of security. Volatility is measured with the use of standard deviations in statistics. So, what Bollinger Bands do is to plot the standard deviation above and below the simple moving average. A simple moving average is used to smooth out the price action.

By plotting the standard deviations above and below the moving average you infact create an envelope that show how much volatile the market is. Widening of the bands show that the market is becoming more volatile while narrowing of the bands show that the market volatility is decreasing. BBs are widely used to determine the overbought/oversold condition in the market as well as confirm divergence between the price action and the indicator. Keep these tips in mind when trading with Bollinger Bands (BBs):

1. Bollinger Bands are plotted above or below the simple moving average.

2. The default settings for the Bollinger Bands simple moving average is 20 periods.

3. The default settings for the two bands is two standard deviations above or below the simple moving average. These bands keep on increasing and decreasing in width as the market volatility increases or decreases.

4. Now, this very important if you change the number of periods of the simple moving average, you should change the standard deviation of the bands as well. For example if you increase the period to 50, increase the standard deviation to two and a half and if you decrease the period to 10, decrease the standard deviation to one and a half. Periods less than 10 do not seem to work well. 20 or 21 period is the optimal setting.

5. You can use any timeframe for using Bollinger Bands that can vary from 5 minutes to daily to weekly or monthly.

6. Rapid price movement tends to take place after the bands tighten.

7. Prices moving above the upper BB is a sign of strength and prices moving below the lower BB is a sign of weakness.

8. When prices move outside the band, tend continuation is a good assumption.

9. A move outside the band followed by a sharp retracement is a sign of price exhaustion.

10. Always use another technical indicator when trading with BBs. One technical indicator that works very well with BBs is the RSI.
By Expert Author Ahmad A Hassam

Tuesday, May 28, 2013

How to Set Up a Forex Trading Business?


How to Set Up a Forex Trading Business


Trading forex--the foreign exchange market--can be a lucrative business that gives you the time and financial freedom to do as you want and live where you please. However, as anybody who has ever traded can tell you, it is not an easy business to become successful at. But if you are willing to put the time and effort in, there are a few tips on how to set up a forex trading business that may save you some headaches along the way.

  1. Decide on a business model.
  2. Find a forex trading system that suits your needs and that wins consistently. 
  3. Find a broker and test it out to see if it suits you
  4.  Choose a business type
  5.  Build a track record
  6. Build a website
  7.  Market your site

Monday, May 27, 2013

US Dollar Index Forecast

US Dollar Index Forecast May 28, 2013, Technical Analysis

On the Memorial Day holiday in the United States, there obviously would have been too much in the way of volume in the futures markets. All of the trading would’ve been done electronically, and by retail traders more often than not. However, it does look like the 83.50 level continues to hold a support for the US Dollar Index, and this of course jive very well with our predictions on this particular contract. With that being said, we are perfectly comfortable going long at this point and aiming for at least 84.50 or so. If we can get above that level, we will eventually find the 88 handle based upon the longer-term charts.

Depressed Aussie dollar could weigh heavily on kangaroo bonds

* Kangaroo issuance at risk as A$ slides
* Bond underwriters already coping with soaring swap costs
* Key hurdle in assessing counterparty risk
By Cecile Lefort
SYDNEY, May 28 (Reuters) - Bond issuance by overseas borrowers in Australia could face strong headwinds as the once-red hot Aussie dollar suffers a violent turnaround, adding to the soaring costs of capital adequacy compliance for bond underwriters.
Kangaroo bonds, Australian dollar-denominated debt issued by foreign borrowers, was about one third of the A$90 billion ($86.75 billion) of non-government bond debt sold locally last year - a useful fee revenue stream for intermediary banks.
But with the Aussie dollar slumping 7 percent this month and hedge funds having recently declared "shorting" the Aussie dollar their favoured strategy, analysts forecast more losses.
"If the Aussie dollar is about to take a nosedive, kangaroo bond issuance may be about to go the same way, especially if current international holders now decide to take profits and reduce their currency exposure," said Phil Bayley, an academic and debt capital market consultant at ADCM.
The Aussie dollar last fetched $0.9621, a level near its weakest in a year.
So far this year, A$13 billion of kangaroo bonds has been sold, down from A$20 billion in 2011 when the Aussie dollar was near a lifetime high above $1.09, according to ThomsonReuters data.
A sharp drop in kangaroo bond sales, however, would rub salt into the wound for many fixed income securities firms struggling with the soaring costs they must incur to protect bank capital under the Basel III rules set by the Bank for International Settlements.
"It's more expensive now than it's ever been to exchange currencies around cross currency swaps because of bank regulatory costs and how people value the risk of their counterparty," said Steve Lambert, executive general manager of debt markets at National Australia Bank.
RBC Capital Markets and Commonwealth Bank of Australia vanished from this year's top 10 ranking of kangaroo bonds, a debt deal denominated in Australian dollars and issued by offshore borrowers, often multilateral institutions such as the Asian Development Bank.
In the past six years, RBC topped the table three times, while CBA came third in 2008 and 2009, ThomsonReuters data shows.
Swaps are an important financial tool as they allow two parties to exchange future cash flows on debt or currencies to hedge risk or make a profit.
A key hurdle faced by bond underwriters is a costly and massive revamping of the banks' internal assessment of how much collateral, usually cash, is needed to back every single uncleared swap trade.
Since a global investment bank typically holds millions of swap contracts on any given day, the equation involves extremely complex calculations. They include credit value adjustments (CVA) on a mark-to-market basis and modelling assumptions which can lead to notably different pricing outcomes.
One banker reckoned the gap could now be up to 20 basis points for the same contract, against one or two bps before. ($1 = 1.0375 Australian dollars) (Additional reporting by Umesh Desai in Hong Kong; Editing by Eric Meijer)

European Stocks Rebound From Weekly Decline; Fiat Rises


European stocks rose, rebounding from their first weekly loss in more than a month, as carmakers and technology companies gained.
Vivendi (VIV) SA climbed the most in two months as Qatar Telecom QSC said it raised $12 billion to finance its bid for the French media and telecommunications company’s stake in Maroc Telecom SA. Fiat SpA (F) advanced 4.4 percent after Italy’s industry minister offered support to keep its plants in the country. Club Mediterranee (CU) SA jumped the most on record after the French holiday-resort operator said it got a bid from two shareholders.
The Stoxx Europe 600 Index climbed 0.3 percent to 304.34 at the close of trading. European stocks fell last week as investors debated when the Federal Reserve will scale back monetary stimulus, while a report showed Chinese manufacturing unexpectedly shrank. Equity markets in the U.S. and U.K. are closed for holidays today.
“We have seen quite a strong correction, especially in the U.S., and it seems like some investors think that the correction is over and they are prepared to go back into the market,” Raimund Saxinger, a fund manager at Frankfurt-Trust Investment GmbH, which oversees about $22 billion, said in a telephone interview. “The closure of the U.K. market is certainly an important influence as liquidity is quite thin.”
The volume of shares changing hands in Stoxx 600 companies was 66 percent lower than the average of the last 30 days, according to data compiled by Bloomberg.
National benchmark indexes climbed in 15 of the 17 western European markets open today. France’s CAC 40 added 1 percent and Germany’s DAX gained 0.9 percent.

Vivendi Stake

Vivendi rose 2.8 percent to 15.60 euros, its biggest gain since March 20. Qatar Telecom, which recently changed its name to Ooredoo, is competing with Emirates Telecommunications Corp. to buy Vivendi’s Maroc Telecom stake and both made binding offers in April. Vivendi wants to complete the sale by October, people familiar with the matter said April 29.
Fiat, Italy’s largest carmaker, climbed 4.4 percent to 5.66 euros, its highest price since August 2011. The Italian government will ask Chief Executive officer Sergio Marchionne what it “can do to let the carmaker keep its plants in Italy,” Industry Minister Flavio Zanonato said in a television interview with Sky Tg24. “We should find a way to match Fiat’s interest with the country’s,” he said.
Club Mediterranee soared 22 percent to 16.95 euros, its biggest gain since at least October 1989. The French all-inclusive tour operator said it received a takeover bid from management and its two largest shareholders, Axa Private Equity and Fosun International Ltd. (656), that values the company at 540 million euros ($699 million).

SAP Gains

SAP AG (SAP) added 2.1 percent to 59.89 euros. The world’s largest maker of business-management software has ended discussions to acquire Jive Software Inc. (JIVE), which has a market value of more than $1 billion, people familiar with the matter said.
SAP quit talks with Jive, which makes social-networking applications for businesses, after a thorough review of the company, said the people, who asked not to be named because the matter is private.
Commerzbank AG advanced 4.5 percent to 8.02 euros. Shares in Germany’s second-biggest lender have still fallen 25 percent this year. Equinet Bank AG upgraded its rating on the stock to buy from sell.
“While the market environment remains tough for Commerzbank and the risks are still significant, we think that the decline in share price has been too much,” Equinet analysts wrote. “Hence, we see now an interesting buying opportunity for speculative investors.”
Praktiker AG tumbled 6.4 percent to 96.4 euro cents, the lowest price since the German home-improvement retailer sold shares to the public in November 2005. Commerzbank downgraded the stock to sell from reduce, saying that cold, wet weather has hurt demand for the company’s products.

To contact the reporter on this story: Jonathan Morgan in Frankfurt at jmorgan157@bloomberg.net
To contact the editor responsible for this story: Andrew Rummer at arummer@bloomberg.net

EUR/USD Weekly

EUR/USD Analysis - 27 May 2013

EUR/USD Weekly


The pair is holding inside the 1.2534-1.4821 range and has completed a upside correction for the 1.3564-1.2788 descendent wave while holding below both its moving averges.

Further upside is expected and on the Daily
timeframe we have a uptrend channel.

Hold buy positions with a target of 1.3545 and a stop loss at 1.2439.

This setup provides a risk/reward of 395/720.

EUR/USD Daily

The pair is holding inside its uptrend channel where it was recently rejected at its support and is located below both its MAs.

A rejection has also taken place above the channel’s ascendent support.

Hold long positions with a target of 1.3091 and a secondary target of 1.3342 while the channel holds.

Stop loss remains at 1.2702.

This setup provides a total risk/reward of 131/515.

Goldenschild Asset Management
http://www.goldenschild.com

Tweet your way to Profitable Trading.

Tweet your way to profitable trading

Amateur investors are starting to use social media to guide their trades.

Twitter
Professional investors have used social media for several years as part of their trading strategy Photo: PA
Whether it is on Twitter, Facebook or more of a niche platform, interacting through social media has become a big part of the way we organise our lives and access information.
But can it make you money? A variety of providers promise to harness the online chatter of friends and strangers to allow people to invest more successfully. At the most basic level this includes forums on which amateurs or professionals swap news or stock tips; more sophisticated users can copy star traders or harness Twitter sentiment to help them make trading decisions.
Professional investors have used social media for several years as part of their trading strategy, as was illustrated neatly last month when a hoax tweet suggesting an attack on the White House knocked 0.9pc off the Dow Jones Industrial Average in a matter of minutes.
The “flash crash” was caused by “algorithms” that react to social media. Algorithms are computer programs that automate trading decisions.
Using Twitter and its rivals has been becoming more common of late among the big banks that move the markets. Last month, financial information group Bloomberg added Twitter to its terminals. The company’s specialist computers are used on every Wall Street trading floor.

Friday, May 24, 2013

EUR/USD flat around 1.2930/35

 EUR/USD flat around 1.2930/35
EURUSD

The shared currency is clinging to the positive territory on Friday, meandering around 1.2930/35 as risk appetite prevails.

“While the EURUSD has thus far failed at cracking $1.3000, evidence is growing that the Euro could stand to benefit from the recent uncertainty regarding the US Dollar and the Yen; there is relatively less uncertainty surrounding the Euro right now. We thus remain bearish, but a close above 1.3000/30 will negate the bearish bias and imply a rally towards 1.3220/50 (mid-April swing highs)”, commented Christopher Vecchio, Currency Analyst at DailyFX.

EUR/USD is now losing a marginal 0.01% at 1.2930 and a break below 1.2900 (MA10d) would accelerate the decline towards 1.2821 (low May 23) and then 1.2809 (low May 20). On the upside, resistance levels align at 1.2998 (high may 22) followed by 1.2999 (MA21d) and finally 1.3030 (high May 14).

The World's Most Powerful Bankers

During the Goldman Sachs trial, Lloyd Blankfein, Goldman Sachs' CEO, became arguably the most well-known banker in the world. Prior to this SEC hearing, most people probably didn't know who was running the most powerful banks in the world - if they gave it any thought at all. Blankfein became the face of the subprime crisis' after-effects, whether he deserved to or not. In the large scheme of things, though Goldman Sachs is one of the largest banks in the U.S., there are still bigger banks stateside and much bigger banks worldwide. We'll take a look at these huge banks and the powerful bankers that run them. (To learn more, see Goldman Sachs: By The Numbers.)

The Public Face
Goldman Sachs is far from the largest bank in the world, but it is considered by many to be the preeminent investment bank in global finance. Lloyd Blankfein is currently the CEO and chairman of the board for Goldman Sachs and has been since 2006. Despite some people's opinion of Blankfein's maneuvers during the financial crisis of 2007 to 2009, the Financial Times named him "person of the year" for 2009. Blankfein received a $9 million (all-stock) bonus from Goldman in 2009, but he grew up in Brooklyn housing projects before making his way to Harvard, where he earned his B.A. and J.D. Blankfein's been working for Goldman since 1981, and he may be most known, aside from the SEC trial, as the banker who claimed he was doing "God's work."

Europe's Biggest Banks and Bankers
The largest global bank in the world is France-based BNP Paribas, which was named largest bank this year by Bloomberg, with assets of $3.2 trillion. This bank was formed through a merger of two of France's biggest banks, Banque Nationale de Paris and Paribas, in 2000. The CEO of this megabank is Baudouin Prot. Prot graduated from the Ecole des Hautes Etudes Commerciales (HEC) and Ecole Nationale d'Administration, and he took a number of positions with the French government before joining BNP in 1983. Prot became CEO of the world's largest bank in 2003. BNP Paribas is different from its large North American counterparts as it emerged from the financial crisis relatively unharmed when compared to their counterparts, and Prot's strategy for the company is seen as one of the reasons that the bank did so well.

Another of the world's largest banks is Munich, Germany's Deutsche Bank, which had assets in excess of 1.5 trillion euros in 2009. Deutsche Bank was founded in 1870 and today is listed on both the Frankfurt and New York Stock Exchanges. The CEO of this German behemoth is Josef Ackermann. Ackermann is originally from Switzerland and has been CEO of Deutsche Bank since 2006. He has also worked at Credit Suisse and served as a guest professor at the London School of Economics. Businessweek reports that Ackermann received compensation of nearly 10 million euros in 2009 at Deutsche Bank.

The U.S.'s Big PlayersTurning back to North America, we'll look at one of the most powerful bankers in the U.S. Jamie Dimon is the CEO of JPMorgan Chase, the largest bank in the U.S. by market capitalization. JPMorgan Chase has assets in excess of $2 trillion, and Dimon has been the CEO since 2004. Dimon got his undergrad in psychology and economics from Tufts University before getting his MBA from Harvard in 1982. Before becoming the CEO of JPMorgan chase, Dimon was one of the people responsible for forming Citigroup, and he was head of Bank One before it was bought by JPMorgan. Dimon and JPMorgan Chase were criticized during the TARP payments of 2008, as many questioned if JPMorgan really needed to be bailed out, but still accepted the TARP bailout, which it later paid back.

The largest bank in the U.S. by assets is Bank of America, with Brian Moynihan as its CEO. Moynihan graduated from Brown in 1981, and then received his Juris Doctorate (JD) from Notre Dame. Moynihan joined Fleet Boston in 1993, and Fleet Boston merged with Bank of America in 2004. Moynihan served in various positions at BofA before becoming CEO in 2009.

Dimon may have helped form Citigroup, but it is going on fine without him at this point, being helmed by Vikram Pandit since 2007. Pandit was born in India but moved to the U.S. when he was 16, doing his schooling there before becoming a professor at Indiana University and eventually joining Morgan Stanley in 1983. He became CEO of Citigroup in 2007, shortly before Citigroup felt the brunt of the subprime crisis and had to receive a large bailout from the U.S. government in 2008. Citigroup has assets of nearly $2 trillion and is one of the Big Four Banks in the U.S, along with Bank of America, JP Morgan Chase and Wells Fargo. (For more, see Banking Has Changed: What Does It Mean For Consumers?)

USD/CAD pullbacks contained around 1.0310/15

The US dollar resumed its momentum against the CAD on Friday, keeping the cross in the positive territory around 1.0310/15.

In the opinion of G.Moore and S.Osborne, FX Strategists at TD Securities, “The trend higher should prevail. Trend momentum signals remain constructive across a range of timeframes and we think this implies limited downside scope and an ongoing, though perhaps grinding (for the moment), bid in funds”.

USD/CAD is now up 0.09% at 1.0315 with the next resistance at 1.0425 (high Jun.5 2012) ahead of 1.0446 (2012 June high) and finally 1.0472 (high Nov.28 2011). On the flip side, a drop beyond 1.0300 (hourly low May 24) would bring 1.0251 (low May 22) and then 1.0246 (MA10d).

Wednesday, May 22, 2013

Bank of England remains split along familiar lines


Bank of England remains split along familiar lines

Nick BeecroftNick Beecroft , Chairman, Saxo Capital Markets UK Limited, Saxo Bank
Filed in Macro Digest
The minutes of the Bank of England's Monetary Policy Committee (MPC) meeting held on May 8 and 9, were released today and continued to reveal a story of a committee with the battle lines still drawn in the same ways as previously.The Dovish camp, The Governor, Paul Fisher and David Miles, would have liked to increase 'the stock of asset purchases financed by the issuance of central bank reserves from GBP 375 billion to GBP 400 billion - i.e. more quantitative easing (QE), but the rest of the MPC members preferred to sit on their collective hands.
To quote the minutes:
'As in February, there was a range of views on the Committee about the outlook for output growth.But, in the Committee’s best collective judgement, the balance of risks was weighted to the downside, reflecting the possibility that the repercussions of the crisis weighed on demand to a greater degree than assumed in the central view.'

USD/CHF Momentum Review

USD/CHF (Momentum Review for 05/22/2013): 

RSI (14):   The RSI (14) is showing signs of increasing bullish momentum (1 hour chart), maintaining the 40-80 bullish range.  A ‘positive RSI reversal’ was confirmed on the hourly chart, which targets 0.9845 (an hourly close above here would likely lead to additional momentum buying).  To conclude, the RSI (14) set up on the daily chart also remains strongly bullish.
MA’s of RSI (14): The 9MA of RSI has crossed above the 45MA of RSI (1 hour chart) which is a bullish development on the short term time frame.  The set up on the daily chart is also strongly bullish.

FX Pattern Review for (05/22/2013):

USD/CHF: 1 hour chart has confirmed an ascending triangle continuation pattern with the 60min close above 0.9750.  Measured move pattern target is 0.9980.
**Shorter term patterns should always be taken in account with the longer term time frame in mind

Shorter Term Time Frames Pattern Table

Chart

Shorter term patterns (Charts)

USD/CHF (1 hour chart): Ascending Triangle - (Bullish)
>1 hour close above 0.9750 has confirmed pattern and targets 0.9980
Chart

EUR/USD falls to fresh lows

FXstreet.com (Córdoba) - The euro continues to weaken versus the dollar and has dropped to fresh daily lows in recent dealings, as investors assess Bernanke's mixed signals on QE.

EUR/USD rallied to the 1.3000 area at the beginning of Bernanke testimony, but then slumped to a low of 1.2850 as Fed Chairman dialed down the dovish tone. EUR/USD is currently trading at the 1.2860 area, where it records a 0.3% loss on the day.

On the downside, immediate support is seen at 1.2840 (low May 21), followed by 1.2795 (low May 17), while on the upside, resistances could now be found at 1.2910 (200-hour SMA) and 1.2960 (intraday level) ahead of 1.3000.

Tuesday, May 21, 2013

The EUR/USD closes above 1.2900

FXstreet.com (San Francisco) - The EUR/USD

Currently, the EUR/USD is trading around 1.2905, still up 0.2% on the day. The short term perspective is slightly bullish in the 1-hour chart according to the FXstreet.com trend index. Indicators such as MACD, CCI and Momentum are pointing to the north while the Stochastic is neutral.

So, what's next? FXstreet.com analyst Valeria Bednarik says that "it's all about central banks," pointing that the BoJ's decision and the BoE and Fed minutes will focus the market attention in the short term. " Bednarik points in a recent report that "many of the voting members, even the ones that opposed earlier this year, had suggested is time to start thinking on a possible end of QE. Market has been steadily pricing it in, buying the USD in advance."

But, what could the market expect from Bernanke? According to the FXBrieft analyst team: "exactly what you got today from Dudley: That policy could go either way depending on how the economy plays out." However, in the event that the Fed offers some hints on QE and/or exit strategies, Bednarik comments that "a change in wording, reinforcing the possibility of tapering QE will likely see greenback extending its advance across the board, while diminishing chances of an end for QE, will likely see the currency suffering a strong set back.

To buy or not to buy?

"I'm a Dollar Buyer. Still a Dollar Buyer," RBS's analyst David Simmonds commented in a recent report as he also stated: "In three words, keep buying Dollars." Simmonds also comments that he has "no arguments with EUR/USD lower either and have long forecast sub 1.20 levels for this year. EUR/USD could be the low-score-bore-draw that it’s been for ages, either side of 1.30, for longer."

UBS Strategists, Gareth Berry and Geoffrey Yu agree with Simmonds on a technical perspective. UBS believes that any upside will be limited as bearish conditions persist. Resistance is at 1.2967 and 1.3020, while support is at 1.2797, a break below would expose 1.2746 ahead of the critical 1.2662.

On the other side, Marc Chandler, Global Head of Currency Strategy at BBH suspects that "Bernanke will recognize, as the FOMC statement did, that the economy is growing at a moderate pace and that decisions on the pace of asset purchases is a function of changes in employment and inflation… If this does in fact materialize, we suspect it would be supportive for US Treasuries while weighing on the dollar."

However, the EUR/USD has found buyers around 1.2840, and as Bednarik says: "The pair will likely range in the 1.2840/1.2950 area ahead of the FED." Clarifications on QE status will decide the trend from then on.
closed on Tuesday its second positive session in row after bottoming at 1.2800 on May 17th. The pair was fueled by the Fed's Dudley and Bullard's speeches and the lack of comments about the Fed tapering bond buying. The EUR/USD rallied from 1.2840 to be capped at 200 hours MA at 1.2935.

Monday, May 20, 2013

GBP/USD Analysis for the Day

GBP/USD Analysis - 20 May 2013

GBP/USD Daily


The pair has broken below its uptrend channel and keeps below both its moving averages in a short-term minor trend while the medium to long term overview remains bullish (intermediary trend is bullish).

 Buy at the current price with a stop loss at 1.5061, a target at 1.5371 and a secondary long-term target at 1.5701.

This provides a risk/reward ratio of 135/515.

Goldenschild Asset Management
http://www.goldenschild.com

 You can also Follow our blog for more analysis
 

Sunday, May 19, 2013

Forex - EUR/USD weekly outlook: May 20 - 24


Investing.com - The euro dropped to six-week lows against the broadly stronger dollar on Friday after better-than-expected U.S. consumer sentiment data fuelled speculation that the Federal Reserve may start to scale back its easing policies this year.

EUR/USD hit 1.2796, the pair’s lowest since April 4, before trimming back losses to settle at 1.2834, down 0.37% for the session and 1.2% lower for the week.

The pair is likely to find support at 1.2750, the low of March 27 and resistance at 1.2888, Friday’s high.

The University of Michigan said its consumer sentiment index jumped to 83.7 in May, its highest level since 2007, from 76.4 in the preceding month, outstripping expectations for a reading of 78.0.

A separate report by the Conference Board showed that its index of leading economic indicators rose 0.6% in April, more than double the 0.2% increase expected by economists.

The robust data bolstered speculation over a possible near-term exit from the Federal Reserve’s USD85 billion a month asset purchase program.

The data came after a series of economic data releases on Thursday raised doubts over the strength of the U.S. economic recovery.

Official data showed that consumer price inflation and housing starts fell more-than-expected in April, while jobless claims posted the largest increase in six months.

The euro remained under pressure amid speculation that the European Central Bank is preparing to cut deposit rates into negative territory. The deposit rate is the rate paid by the ECB on overnight deposits by euro zone banks.

In the week ahead investors will be focusing on Wednesday’s Federal Reserve minutes, as well as testimony on the economic outlook and monetary policy by Fed Chairman Ben Bernanke.

Markets will also be watching euro zone data on manufacturing and service sector activity.

Ahead of the coming week, Investing.com has compiled a list of these and other significant events likely to affect the markets. The guide skips Monday as there are no relevant events on this day.

Financial World News Releases


This week has proved again that fundamental news are not even close to move the market, when sentiment leads: investors are turning towards the US and the possibility of tapering QE as soon as this summer, and discouraging US macro numbers were not enough to put dollar upward momentum down. For the upcoming week, there’s little first line data to watch coming from the US, but as usual, there will be no lack of market movers, and Central Banks will take the lead: here they are.

AUD and RBA Policy meeting Minutes, May 21st

  • Hawkish: AUD bullish
  • Dovish: AUD bearish
  • Key pairs to watch: AUD/USD, AUD/JPY
With the release of the Minutes of the latest RBA decision to lower the cash rate by 25 basis points to 2.75%, market players will be looking for tips over next movements. RBA Governor Glenn Stevens has declared that growth in Australia was “a bit below trend in the second half of 2012, and this appear to have continued into 2013” while despite employment has continued to grow, labor force grew even more, increasing unemployment rate.
With Aussie in a bearish trend, comments pointing towards further economic slowdown and possibilities of a rate cut, will rush market players to price in another rate cut, leading to more AUD slides. A more positive wording should on contrary favor an upward correction in AUD, although may not be enough to change the trend in term.

JPY and BOJ Monetary policy decision, May 22nd

  • Hawkish/no announcements: JPY bullish
  • Dovish/Announcement of new measures: JPY bearish
  • Key pairs to watch: USD/JPY, EUR/JPY, GBP/JPY
It will be hard for the BOJ to surprise markets this month: early April the Central Bank launched an aggressive campaign to fight deflation, announcing a set of policies that that exceeded market expectations: The BOJ will not only expand its balance sheet by purchasing longer-term debt and more exotic securities like ETFs, but will also merged its asset-purchase programs and suspended a rule that prohibited the purchase of longer-term debt.
A 2% inflation target remains the priority for PM Shinzo Abe, and market will need a large dose of facilities plus a still negative growth outlook, to take yen bearish run even further. A neutral stance coming from the Central Bank may favor some temporal yen gains that anyway won’t affect the dominant trend.

GBP and BOE Minutes, May 22nd

  • Hawkish: GBP bullish
  • Dovish: GBP bearish
  • Key pairs to watch: GBP/USD, EUR/GBP, GBP/JPY
During the last meeting the BOE left its economic policy unchanged, refraining from taking action ahead of governor’s swap. Mervin King will step down on June 30th this year to be replaced by Mark Carney, current Bank of Canada governor. However, the latest inflation report showed the country is somehow giving signs of growth which suggest the Minutes may offer further positive comments over the economic situation.
In such case market will be little surprised, and despite bullish for Pound, most of it is already priced in and should lead to temporal rallies. A step back on comments towards a negative economic outlook will likely put GBP under selling pressure.

USD and FED Minutes, May 22nd

  • Maintaining QE: USD Bearish
  • Tapering QE: USD Bullish
  • Key pairs to watch: EUR/USD, USD/JPY, AUD/USD, GBP/USD
Minutes had been pretty irrelevant lately, as the wording has been maintained steady: economic growth remains sluggish and will proceed at a moderate pace, while unemployment rate will gradually decline toward levels consistent with FED’s mandate. Even more, latest economic decision has shown that policy will remain accommodative, which means rates will stay at record lows and the FED will continue to buy $85 billion a month in Treasury and mortgage bonds at least until unemployment falls to 6.5%.
However, many of the voting members, even the ones that opposed earlier this year, had suggested is time to start thinking on a possible end of QE. Market has been steadily pricing it in, buying the USD in advance. A change in wording, reinforcing the possibility of tapering QE will likely see greenback extending its advance across the board, while diminishing chances of an end for QE, will likely see the currency suffering a strong set back.

Friday, May 17, 2013

Trade Idea : GBP/USD - Sell at 1.5335

GBP/USD - 1.5251    
     
Original strategy :      
     
Sell at 1.5335, Target: 1.5180, Stop: 1.5370
     
Position: -
Target:  -
Stop:-
     
New strategy  :     
  
Sell at 1.5335, Target: 1.5180, Stop: 1.5370
     
Position: -
Target:  -
Stop:-

Although cable has retreated again after meeting resistance at 1.5323 yesterday, break of this week's low of 1.5173 is needed to signal recent decline has resumed and extend weakness to 1.5150 but loss of downward momentum should prevent sharp fall below 1.5130-34 (61.8% projection of 1.5593-1.5275 measuring from 1.5331) and reckon 1.5100 would hold from here. If said support continues to hold, then further consolidation is in store and another bounce cannot be ruled out, above 1.5283-85 would bring recovery to 1.5330-33 (yesterday's high and 38.2% Fibonacci retracement of 1.5593-1.5172) but renewed selling interest should emerge there, bring another decline.
In view of this, we are looking to sell cable on further recovery. Only above 1.5383-85 (50% Fibonacci retracement and this week's high) would dampen this bearishness and risk a stronger correction of recent decline to 1.5415-20 and possibly towards 1.5432-35 (61.8% Fibonacci retracement of 1.5593-1.5173) before another selloff.

EUR/USD changed a little after EMU data

The shared currency kept the range after the Construction Output in the euro area contracted 1.7% on a monthly basis during March, prolonging the negative momentum in the cross after February’s drop of 0.3%.

Against the backdrop of mounting rumours about the next steps of the Fed, Strategist Derek Halpenny at BTMU commented, “Next week we have Bernanke testifying to the Joint Economic Committee (Wednesday) and this is now is a very important event for shaping market expectations”.

As of writing, the pair is losing 0.10% at 1.2869 with the next support at 1.2843 (low May 15) ahead of the psychological mark at 1.2800 and finally 1.2740 (2013 low Apr.14).
On the flip side, a breakout of 1.2930 (high May 16) would open the door to 1.2943 (high May 15) and then 1.3030 (high May 14).

Thursday, May 16, 2013

NZD/USD strategy profile – Westpac

FXstreet.com (Barcelona) - The New Zealand calendar highlight next week is the RBNZ’s survey of inflation expectations (Tuesday). According to Sean Callow, a Global FX Strategist at Westpac, “We expect a soft outcome given the surprisingly low level of actual inflation during the past few quarters.” - also out will be services PMI (Monday), migration and credit card spending (Tuesday), and the trade balance (Friday).

“Despite strong NZ fundamentals, most recently exemplified by the annual budget, which saw public borrowing requirements fall, the currency remains hostage to the whims of the US dollar which has surged recently. Momentum in NZD/USD is negative, and the break below trend support since July points towards 0.7800. Extreme long speculative positioning remains the NZD’s strongest headwind.” Callow warns.

Majors consolidate, AUD and NZD underperform

FX market saw a quiet European session on Thursday, with the dollar mixed across the board and most crosses consolidating within their recent ranges. The EUR/USD trades around 1.2875, virtually unchanged ahead of the NY, where investors will be watching for April inflation data, housing starts, building permits and initial jobless claims.

However, Antipodean currencies are underperforming. The Australian dollar fell to a fresh 11-month low below 0.9800, while the Kiwi dollar hit a 6-month low against the greenback.

Wednesday, May 15, 2013

ECB Likes Seeing EUR/USD at 1.2870

The euro’s fall to six-week lows is likely to be welcomed by the European Central Bank (ECB), which has been trying to talk down the currency. Yet to really take the shine off the euro, policymakers need to show they are serious about pushing rates into negative territory, strategists said.
The euro fell to $1.2842 on Wednesday, its lowest level since April 4, after data showed the euro zone economy contracted for the sixth straight quarter at the start of the year, marking its longest recession on records that date back to 1995.
Still, the euro had clawed back about a third of a percent to $1.2878 by early Asian trade on Thursday and strategists say the single currency continues to be supported by strong inflows of foreign cash into peripheral euro zone government bond markets.

Tuesday, May 14, 2013

AUD/USD Daily Fx Outlook

AUD/USD Daily Outlook

Daily Pivots: (S1) 0.9840; (P) 0.9922; (R1) 0.9967; More...
AUD/USD drops further to as low as 0.9876 so far today and intraday bias remains on the downside. AUD/USD is currently pressing the lower trend line support (now at 0.9880) and we'd be cautious on rebound from here. Though, as long as 1.0003 minor resistance holds, deeper decline is expected. Sustained break of the trend line will pave the way to retest 0.9588 support. On the upside, above 1.0003 will bring recovery but risk will stay on the downside as long as 1.0220 resistance holds.
In the bigger picture, price actions from 1.1079 high are treated as a consolidation pattern in the larger up trend, in form of a triangle. There is no clear sign of breakout yet. But in case of another fall, downside should be contained above 0.9588. Meanwhile, break of 1.0581 will be an early sign of up trend resumption and should bring retest of 1.1079 high next.
AUD/USD 4 Hours Chart
AUD/USD Daily Chart

AUD/USD Closes in on 2.5 Year Trendline

Daily Bars
eliottWaves_aud-usd_body_audusd.png, AUD/USD Closes in on 2.5 Year Trendline; ‘Snapback’ Risk Increases
Chart Prepared by Jamie Saettele, CMT using Marketscope 2.0
Are you new to FX or curious about your trading IQ?
FOREXAnalysis: AUDUSD near term focus is on .9800 (78.6% of rally from .9580) although the line that extends off of the 2011 and 2012 lows is at about .9858 on Wednesday. The presence of these levels increases the risk of a bounce…resistance is estimated between .9977 and parity.
FOREXTrading Strategy: I exited the short today but the bias is still short…now against 1.0170. Looking to short again between .9977 and 1.0030. The decline may take a more choppy form from this level down to .9700.
LEVELS: .9700 .9800 .9855 .9939 1.0003 1.0030

Currency Majors Technical Analysis

BETA - Propareos levels (areas where probabilities of price action reversal or saturation reach 90%; valid till 09:00 GMT):
  • EURUSD: 1.3055-1.3070 on the upside, 1.2935-1.2950 on the downside.
  • AUDUSD: 1.0125-1.0140 on the upside, 0.9870-0.9885 on the downside.
  • USDJPY: 102.10-102.25 on the upside, 100.50-100.65 on the downside.
  • GBPUSD: 1.5410-1.54255 on the upside, 1.5245-1.5260 on the downside.
  • USDCAD: 1.0135-1.0150 on the upside, 1.0025-1.0040 on the downside.
  • NZDUSD: 0.84655-0.8480 on the upside, 0.8175-0.8190 on the downside.
  • EURJPY: 132.50-132.65 on the upside, 130.60-130.75 on the downside.
  • EURGBP: 0.8525 -0.8540 on the upside, 0.8380-0.8395 on the downside.
  • USDCHF: 0.9585-0.9600 on the upside, 0.9430-0.9445 on the downside.
  • AUDJPY: 102.20-102.35 on the upside, 100.65-100.80 on the downside.
  • EURAUD: 1.3080-1.3095 on the upside, 1.2900-1.2915 on the downside.
Warning! Propareos levels do not take into account fundamental developments. Their validity is reduced on days when the NFP is released and when Central Banks change their interest rate.

Monday, May 13, 2013

Technical Analysis for Pacific Crosses

Technical Analysis for Crosses

GBP/JPY

The GBPJPY pair was initially rejected from 156.75 resistance level, to retreat currently approaching the previous high at 154.75 which may form a support for the currently bullish wave, it's also near the minor ascending trend line shown on the chart above. Accordingly, we expect a bullish rebound over intraday basis.
Support: 154.75, 153.85, 153.35, 152.50, 152.00
Resistance: 155.80, 156.75, 157.50, 158.35, 159.00
Recommendation Based on the charts and explanations above, we prefer to long the pair above 154.70 targeting 155.80,156.75 and 158.30. Stop loss at four-hour closing below 153.35


EUR/JPY

The EURJPY pair continues to fluctuate narrowly around 132.00 key resistance, while we spotted a bearish divergence on RSI over the four-hour and daily time intervals. Accordingly, we prefer to remain on the sidelines today as well, as we may see a downside pullback. A clear break above 132.00 may negate the divergence and force us to reconsider the bullish scenario.
Support: 131.00, 130.50, 129.90, 129.00, 128.50
Resistance: 132.00, 132.75, 133.50, 134.30, 134.90
Recommendation Based on the charts and explanations above, we prefer to remain on the sidelines awaiting confirmation

Retracement Trading for Scalpers

Scalpers and Forex day traders can select from a variety of strategies to trade short term graphs. Normally these strategies will revolve around taking advantage of market momentum or scalping breakouts with the trend. Today we will examine the art of scalping retracements swings using a technical oscillator.
As discussed in our previous scalping lesson, the NZDUSD remains in an excellent position to look for scalping opportunities. As of today, the NZDUSD has moved to a fresh monthly low for May and has declined as much as 310 pips from last week’s high. Traders looking for retracements will look for pullbacks against the trend then sell when price momentum returns. Let’s look at an example of exactly how this is done.
Learn Forex: NZDUSD 2Hour Trend
Retracement_Trading_for_Scalpers_body_Picture_2.png, Retracement Trading for Scalpers
(Created using FXCM’s Marketscope 2.0 charts)
Now that a trend is found, remember retracement traders will look for opportunities to sell at the best price possible as the market makes a lower high counter the primary trend. These points are called swing highs and are generally created near points of short term resistance. The key to this style of trading is patience and waiting for price to resume back in the direction of the trend. To help in the timing of placing a market entry, traders normally will employ the use of a technical indicator such as an oscillator.
Oscillators are trading indicators that track price from a defined center point over a predefined number of periods. Below we can see CCI (Commodity Channel Index) on a 5minute chart. Retracement traders will first wait for CCI to reach an overbought level over +100 in a downtrend. This overbought reading indicates that price has made a relative high for the chart, and traders will now look for opportunities to sell when price begins to decline again. Normally, a crossover methodology is used with traders selling the market when CCI dips back below +100.
Learn Forex: NZDUSD CCI Entries
Retracement_Trading_for_Scalpers_body_Picture_1.png, Retracement Trading for Scalpers
(Created using FXCM’s Marketscope 2.0 charts)
As you can see retracement swings can be an effective way for Forex scalpers to approach a strong directional market. However, it is important that short term trends will often come to an abrupt conclusion. In the event that price begins to change direction and create higher highs in a downtrend, stops should be placed on all positions. Traders scalping retracement swings can identify great Risk/Reward levels by placing stops above the swing highs previously used for entries. This way all sell based positions are exited in the event price attempts to break upwards to higher highs.

---Written by Walker England, Trading Instructor  

EURUSD Bearish Engulfing Hourly Chart


Resistance: 1.2975 moderate/1.3076 strong/1.3142 moderate
Support: 1.2909 minor/1.2808 minor

The Bearish Engulfing in Hourly charts is a confirmation of the overall bearish trend. With a moderate resistance at, 1.2975 consider shorts from the said price with a stop loss above it. Alternatively stops could be placed above the pattern high. Immediate objective is 1.2909, break of which opens us to a sell-off to 1.2808.

Sunday, May 12, 2013

GBP/USD opening in 1.5350 territories


GBP/USD opening in 1.5350 territories

FXstreet.com (London) - Sterling has started the European session decisively below the 1.5400 handle where it fell over 100 pips last week to trade at its lowest level in 2 weeks, finding bids at 1.5310. It is currently trading at 1.5360 at the time of writing.

There has been a decline in Sterling from 1.5606 already this month in the face of broad dollar strength and renewed optimism for a recovery in the USA. Else where, Central banks can be seen to be easing and reform in such economies as, say, Japan, are weakening their currency, which have been seen to support the dollar and dollar denominated investments. Given the sharp decline in Sterling, bears may be hesitating this morning ahead of a jam-packed week of economic data and hourly indicators are slightly bullish for the moment for the pair. Support is seen at 1.5350 with EMA10 1.5356.

AUD/USD looks set to test trendline at 0.98/0.9850

FXstreet.com (Barcelona) - After the AUD/USD broke below $1.00 for the first time since last June, Marc Chandler, Head of Curency Analysts at BBH, expect now a technical bounce "to alleviate the over-extended technical condition which could see the Aussie trade toward $1.0070-$1.0100" he said. After the correction, "we look for the Aussie to test the trend line drawn off the 2011 and 2012 lows, which comes in near $0.9800 now and $0.9850 by the end of the quarter."

How I am Trading USD/CHF, GBP/USD, AUD/USD and NZD/USD

How I am Trading USD/CHF, GBP/USD, AUD/USD and NZD/USD
By Jamie Saettele, CMT, Sr. Technical Strategist
12 May 2013 19:58 GMT

Indications are that the USD breakout is real. I'll be net long USD until further notice but position size will vary as the USD trades into resistance (less long USD) and into support (more long USD). Many that are correct about bigger picture direction will still lose money or not make as much as they should because their timing will be poor. The next few days may produce some sideways/corrective USD action...the GBPUSD is at channel support and the 13 week midpoint...the AUDUSD traded into the 6/25 low...the NZDUSD is at the trendline that extends off of the 2012 and 2013 lows and the downward sloping channel that defines the decline from the April high....the USDCHF traded into the 61.8% retracement of the decline from the 2012 high.

The following are levels that I'm looking to be more long USD (these are not orders...rather levels to watch for reactions).

USDCHF .9500

GBPUSD 1.5400

AUDUSD 1.0060/90

NZDUSD .8350/80

The following are levels that I'm looking to be less long USD (these are orders).

USDCHF .9745

GBPUSD 1.5200

AUDUSD .9700

NZDUSD .8055

Japan Money Stock data due out today

| 0 comments

At 2350GMT we get the release of Japanese Money Stock, both M2 and M3 for April.
For M2:
  • Prior was 3.0%
  • Expected is 3.1%
For M3
  • Prior was 2.5%
  • and expected is 2.5%
While the market will want to see continued expansion of these figures, the focus is elsewhere, namely USD strength. There are also sell orders clustered ahead of 102 (102 is one leg of the 97 – 102 DNT option that is currently in place). Buy orders around 101.10 and 101.30 (I’ll have more on orders as the morning progresses).

Dollar Surge is Only the Beginning

Dollar Surge is Only the Beginning

By , Quantitative Strategist
10 May 2013 22:15 GMT
forex_forecast_us_dollar_headed_higher_body_Picture_5.png, Dollar Surge is Only the Beginning
Dollar Surge is Only the Beginning
Fundamental Forecast for US Dollar: Bullish

Weekly Forex Forecasts for Majors

Weekly Forex Forecasts

AUD/USD Forecast May 13-17

In a surprise move, the RBA cut interest rates to 2.75%, and reiterated that it remained concern about the high value of the Australian dollar. The Aussie responded by dropping sharply. Although Australian employment numbers looked sharp, this was not enough to stem the sharp downward slide.
Read the rest of the article AUD/USD Forecast May 

USD/JPY Outlook May 13-17

USD/JPY was the big star of the week, finally breaking the 100 line and with a big blast. Is the road open to 105, or will we see some consolidation?Tertiary Industry Activity, GDP and Core Machinery Orders are the main events this week. Here’s an outlook for the Japanese events and an updated technical analysis for USD/JPY. The

USD/CAD Outlook May 13-17

USD/CAD was already very close to the parity line, but retreated on the dollar storm. Manufacturing Sales and inflation data are the main market-movers this week. Here is an outlook on the major market-movers and an updated technical analysis for USD/CAD. Last week, Canada’s jobs report came out within expectations; unemployment rate remained 7.2% in

EUR/USD Forecast May 13-17

EUR/USD suffered a downfall at the end of busy week that saw the dollar surge across the board. Will the pair continue lower? German ZEW Economic Sentiment and GDP figures are the highlights of this week.  Here is an outlook on the events and an updated technical analysis for EUR/USD, now on lower ground. German

Friday, May 10, 2013

Daily Forecast: AUD/USD ; USD/CAD ; USD/JPY ; USD/CHF

Daily Forecast: AUD/USD ; USD/CAD ; USD/JPY ; USD/CHF

( Be first to comment on this item! )
AUD/USD drops sharply to as low as 1.0037 so far today. The strong break of 1.0115 indicates strong downside momentum. Intraday bias remains on the downside and current fall would now target 61.8% retracement of 0.9588 to 1.0624 at 0.9984 and below. On the upside, above 1.0154 minor resistance will turn bias neutral and bring recovery. But risk will stay on the downside.
In the bigger picture, price actions from 1.1079 high are treated as a consolidation pattern in the larger up trend, in form of a triangle. There is no clear sign of breakout yet. But in case of another fall, downside should be contained above 0.9588. Meanwhile, break of 1.0624 will be an early sign of up trend resumption and should bring retest of 1.1079 high next.
Daily Pivots: (S1) 1.0006; (P) 1.0130; (R1) 1.0214; ...
USD/CAD recovered strongly from 1.0113 and bullish divergence condition in 4 hours MACD argues that a short term bottom in place. Stronger rebound could be seen. But break of 1.0132 minor resistance is needed to be the first sign of reversal. Otherwise, deeper decline is still mildly in favor. Below 1.0013 will target 61.8% retracement of 0.9633 to 1.0341 at 0.9903. Though, above 1.0132 will turn focus back to 1.0293 resistance.
In the bigger picture, price actions from 1.0656 are viewed as a correction pattern, no change in this view. The current development raised the possibility that such consolidation is still in progress. Another fall could have just started but downside should be contained above 0.9406 and bring rebound. Meanwhile, break of 1.0341 is needed to signal upside momentum. Or, we'd expect more range trading between 0.9406/1.0341.
Daily Pivots: (S1) 1.0024; (P) 1.0056; (R1) 1.0100; ...
USD/JPY rises to as high as 101.19 so far today and has finally took out 100 psychological level. Recent up trend has resumed and current rise should now extend to 161.8% projection of 77.13 to 96.70 from 92.56 at 104.65 next. On the downside, break of 99.45 support is needed to signal short term topping. Otherwise, outlook will stay bullish in case of retreat.
In the bigger picture, whole decline from 124.13 should have already completed at 75.56. Stronger medium term rally could be seen back towards 101.65 key support turned resistance level. We'll see how USD/JPY responds at around 100 to judge the underlying medium term momentum for stronger up trend. Sustained break there should at least push USD/JPY through 61.8% retracement of 124.13 to 75.56 at 105.57. Meanwhile, break of 92.56 support is needed to be the first sign of medium term topping. Otherwise, we'll stay bullish.
Daily Pivots: (S1) 99.24; (P) 100.01; (R1) 101.38; ...
USD/CHF rises further to as high as 0.9525 so far today and the break of 0.9498 argues that consolidation from 0.9566 is already completed. Intraday bias is back on the upside for retesting 0.9566 first. Break will confirm resumption of whole rebound from 0.9021. On the downside, below 0.9436 will turn bias neutral and mix up the near term outlook again.
In the bigger picture, medium term rebound from 0.7065 is viewed as a corrective move and should have completed after hitting 0.9916 resistance (61.8% retracement of 1.1730 to 0.7065 at 0.9948). Price actions from 0.9971 are expected to develop into a sideway pattern. That is, rise from 0.9021 would have a test on 0.9971 and have another fall before resuming the larger up trend. However, break of 0.9021 support will suggest that fall from 0.9971 is developing into to deep correction that instead, that should reach 38.2% retracement of 0.7065 to 0.9971 at 0.8861 and below.
Daily Pivots: (S1) 0.9377; (P) 0.9437; (R1) 0.9542; ...

AUDUSD orders


AUDUSD orders


As I said earlier, always expect the unexpected .
Right where was I? oh yes. this AUDUSD orders post…
We’ve seen the strong buying interest at 1.0050 smashed and now we have have second wave lower with lows posted of 1.0031. Barrier option interest at 1.0025 remains. currently 1.0048
Sellers 1.0075,1.0090,1.0100,1.0120,1.0150,1.0190,1.0200,1.0250
Buyers 1.0025,1.0020,1.0000,0.9980,0.9950
audusd orders 10 may

Thursday, May 9, 2013

Daily Forex Fundamentals

Daily Forex Fundamentals - May 10, 2013

U.S. Dollar (USD)

Forex Traders Lounge
It looks as though dollar bulls were just waiting for the right moment to strike! After putting up unimpressive performances for the past two days, the dollar struck its major counterparts to the ground with help from strong jobs data. USD/JPY broke above 100.00 as it finished the day 171 pips higher. Meanwhile, EUR/USD slipped 123 pips to 1.3032. Read more...

Euro (EUR)

Rough day at the office for the euro, as it sank down the charts versus the dollar yesterday. EUR/USD gave back all its gains from the day before and then some, as it finished at 1.3032, marking a 123-pip loss for the day. Read more...

British Pound (GBP)

The party continues! Currency bulls extended the pound's rally yesterday after reports from the U.K. printed to the upside. GBP/USD popped up by 171 pips and EUR/GBP slipped 29 pips. Only GBP/USD missed the pound appetite train as it fell 92 pips below its open price. Read more...

Japanese Yen (JPY)

No mixed results this time around... The markets voted unanimously against the yen, making it yesterday's weakest performer. For the first time since April 2009, USD/JPY broke above 100.00, closing 171 pips higher. Likewise, EUR/JPY forged a new high of its own as it closed 101 pips higher at 131.18. Read more...

Canadian Dollar (CAD)

And the winning streak ends! For the first time in 6 days, the Canadian dollar failed to edge higher versus the dollar, as USD/CAD finished at 1.0076, up 43 pips from its opening price. Read more...

Australian Dollar (AUD)

Just when it looked as though the Aussie was finally gearing up for a major comeback, it was crippled by a strong U.S. jobs report. AUD/USD rallied early in the day to tap a high of 1.0255, only to come crashing down and finish at 1.0080. Read more...

New Zealand Dollar (NZD)

Positive employment reports? So what? Just when we thought that NZD/USD was headed for its previous highs on the daily chart, the comdoll bears jumped in the forex arena and dragged the pair well below its highs. NZD/USD finished the day at .8377 after hitting an intraday high at .8482. Read more...

Swiss Franc (CHF)

With no data out from Switzerland yesterday, the franc danced to the tune of its counterparts' price action. USD/CHF shot up by a whopping 130 pips while EUR/CHF tipped an intraday high of 1.2409 before closing 53 pips higher than its open price. Read more...

In forex trading, you get better odds at securing pips when your fundamental analysis is complemented by technical analysis.

US Dollar Soars as S&P 500 Stalls Below Chart Resistance

By , Currency Strategist
10 May 2013 02:42 GMT  
THE TAKEAWAY: The US Dollar raced upward to produce what appears to be a meaningful topside breakout while the S&P 500 has stalled at chart resistance, hinting at a pullback.
US DOLLAR TECHNICAL ANALYSIS Prices broke above resistance at the top of a rising channel set from early March, exposing the 123.6% Fibonacci expansion at 10640. A further push above that targets the 138.2% mark at 10668. The channel top – now at 10590 – has been recast as near-term support.
Forex_US_Dollar_Soars_as_SP_500_Stalls_Below_Chart_Resistance_body_Picture_5.png, US Dollar Soars as S&P 500 Stalls Below Chart Resistance
Daily Chart - Created Using FXCM Marketscope 2.0
S&P 500 TECHNICAL ANALYSIS – Prices put in a Harami candlestick pattern below resistance at 1633.20, the 38.2% Fibonacci expansion, hinting a move lower may be ahead. Near-term support is marked by the psychologically significant 1600 figure and the 23.6% level at 1595.90. A break below that initially exposes the 14.6% Fib at 1572.90. Alternatively, a reversal above resistance eyes the 50% expansion at 1663.30.
Forex_US_Dollar_Soars_as_SP_500_Stalls_Below_Chart_Resistance_body_Picture_6.png, US Dollar Soars as S&P 500 Stalls Below Chart Resistance
Daily Chart - Created Using FXCM Marketscope 2.0