
 Bollinger bands are used to measure the volatility in the price action. They work in almost all market and with any type of security. Volatility is measured with the use of standard deviations in statistics. So, what Bollinger Bands do is to plot the standard deviation above and below the simple moving average. A simple moving average is used to smooth out the price action.
By plotting the standard deviations above and below the moving average you infact create an envelope that show how much volatile the market is. Widening of the bands show that the market is becoming more volatile while narrowing of the bands show that the market volatility is decreasing. BBs are widely used to determine the overbought/oversold condition in the market as well as confirm divergence between the price action and the indicator. Keep these tips in mind when trading with Bollinger Bands (BBs):
1. Bollinger Bands are plotted above or below the simple moving average.
2. The default settings for the Bollinger Bands simple moving average is 20 periods.
3. The default settings for the two bands is two standard deviations above or below the simple moving average. These bands keep on increasing and decreasing in width as the market volatility increases or decreases.
4. Now, this very important if you change the number of periods of the simple moving average, you should change the standard deviation of the bands as well. For example if you increase the period to 50, increase the standard deviation to two and a half and if you decrease the period to 10, decrease the standard deviation to one and a half. Periods less than 10 do not seem to work well. 20 or 21 period is the optimal setting.
5. You can use any timeframe for using Bollinger Bands that can vary from 5 minutes to daily to weekly or monthly.
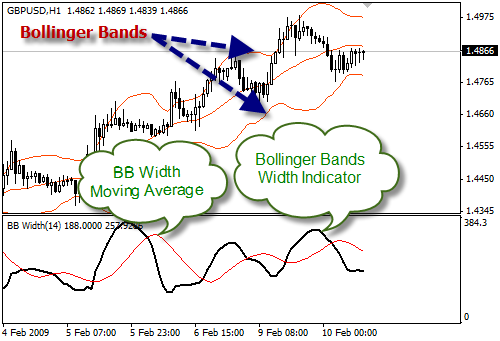
6. Rapid price movement tends to take place after the bands tighten.
7. Prices moving above the upper BB is a sign of strength and prices moving below the lower BB is a sign of weakness.
8. When prices move outside the band, tend continuation is a good assumption.
9. A move outside the band followed by a sharp retracement is a sign of price exhaustion.
10. Always use another technical indicator when trading with BBs. One technical indicator that works very well with BBs is the RSI.
By Expert Author Ahmad A Hassam
No comments:
Post a Comment