
US Dollar Soars as S&P 500 Stalls Below Chart Resistance
By Ilya Spivak, Currency Strategist
US DOLLAR TECHNICAL ANALYSIS– Prices broke above resistance at the top of a rising channel set from early March, exposing the 123.6% Fibonacci
expansion at 10640. A further push above that targets the 138.2% mark
at 10668. The channel top – now at 10590 – has been recast as near-term
support.
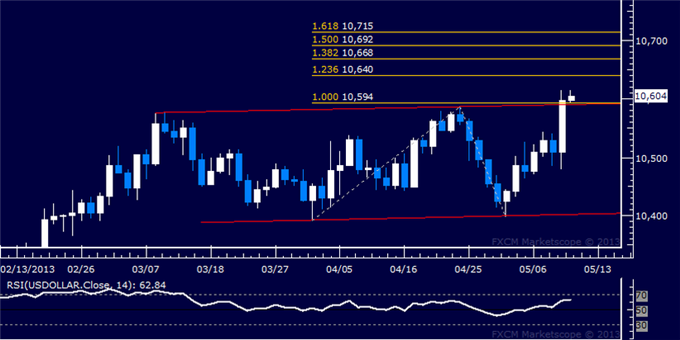
Daily Chart - Created Using FXCM Marketscope 2.0
S&P 500 TECHNICAL ANALYSIS
– Prices put in a Harami candlestick pattern below resistance at
1633.20, the 38.2% Fibonacci expansion, hinting a move lower may be
ahead. Near-term support is marked by the psychologically significant
1600 figure and the 23.6% level at 1595.90. A break below that initially
exposes the 14.6% Fib at 1572.90. Alternatively, a reversal above
resistance eyes the 50% expansion at 1663.30.
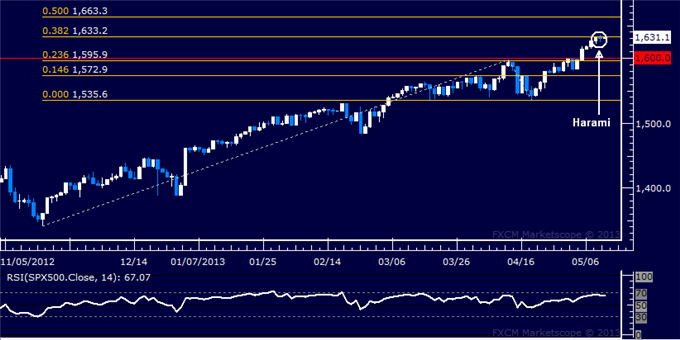
Daily Chart - Created Using FXCM Marketscope 2.0
No comments:
Post a Comment