
US Dollar Adrift as S&P 500 Rally Continues to Power Ahead
By Ilya Spivak, Currency Strategist
US DOLLAR TECHNICAL ANALYSIS– Prices are retesting recently broken resistance-turned-support at 10488, the 14.6% Fibonacci
retracement. A break below that targets the 10424-28 area, marked by
the 23.6% level and the March 22 close. Near-term resistance is at
10576, the March 11 high, with a reversal above that targeting the 38.2%
Fib expansion at 10655.
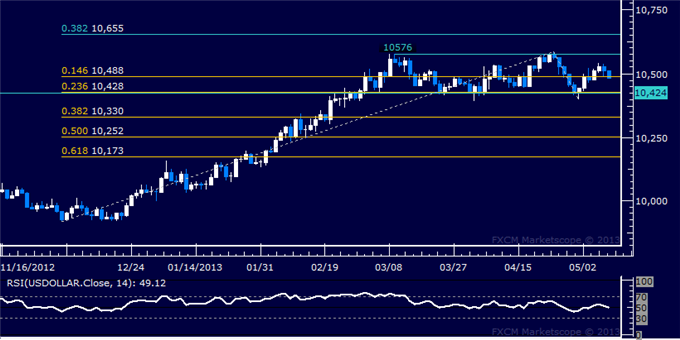
Daily Chart - Created Using FXCM Marketscope 2.0
S&P 500 TECHNICAL ANALYSIS – Prices are testing resistance at 1633.20, the 38.2%Fibonacci
expansion. A break higher targets the 50% level at 1663.30. Near-term
support is marked by the 23.6% Fibonacci expansion (1595.90) and the
psychologically significant 1600 figure. A reversal back beneath that
aims for the 14.6% expansion at 1572.90.
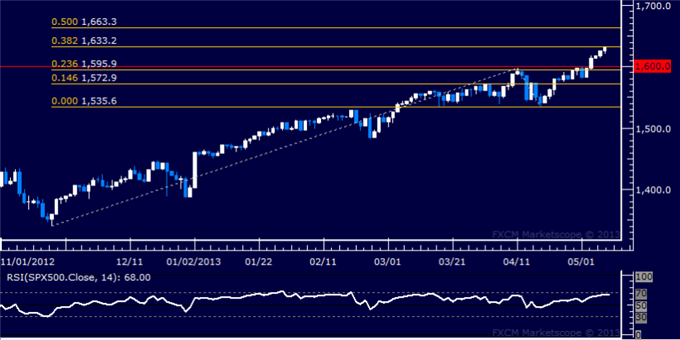
Daily Chart - Created Using FXCM Marketscope 2.0
No comments:
Post a Comment