
THE TAKEAWAY: The
US Dollar continued to drift higher within a familiar range while the
S&P 500 pushed upward to set a new record high above the 1600
figure.
US DOLLAR TECHNICAL ANALYSIS– Prices recovered after putting in a Hammer candlestick above support in the 10424-28 area marked by the 23.6% Fibonacci
retracement and the March 22 close. Buyers have now cleared resistance
at 10488, the 14.6% level, exposing the March 11 high at 10576. A
further push above that targets the 38.2% Fib expansion at 10655. The
10488 level has been recast as support, with a turn back beneath that
eyeing 10424-28 anew.
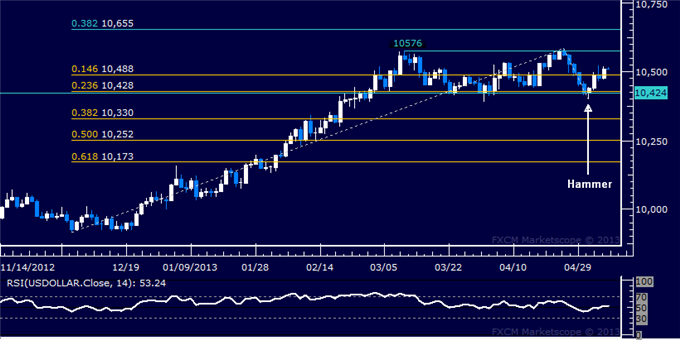
Daily Chart - Created Using FXCM Marketscope 2.0
S&P 500 TECHNICAL ANALYSIS
– Prices broke resistance marked by the 23.6% Fibonacci expansion
(1595.90) and the psychologically significant 1600 figure. Buyers now
look to challenge the 38.2% level at 1633.20, with a further push beyond
that aiming for the 50% Fib at 1663.30. Alternatively, a reversal back
below 1595.90 initially exposes the14.6% expansion at 1572.90.
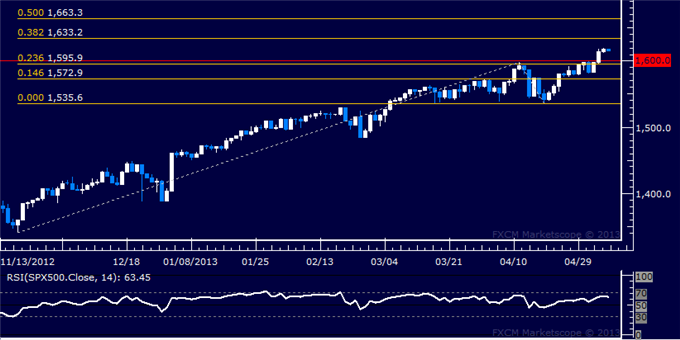
Daily Chart - Created Using FXCM Marketscope 2.0
No comments:
Post a Comment